AI Stock Trading Tool
An end-to-end Python trading system with rigorous backtesting and safe paper execution. Testing found no strategy beat buy-and-hold, so I stopped the project.
The Problem
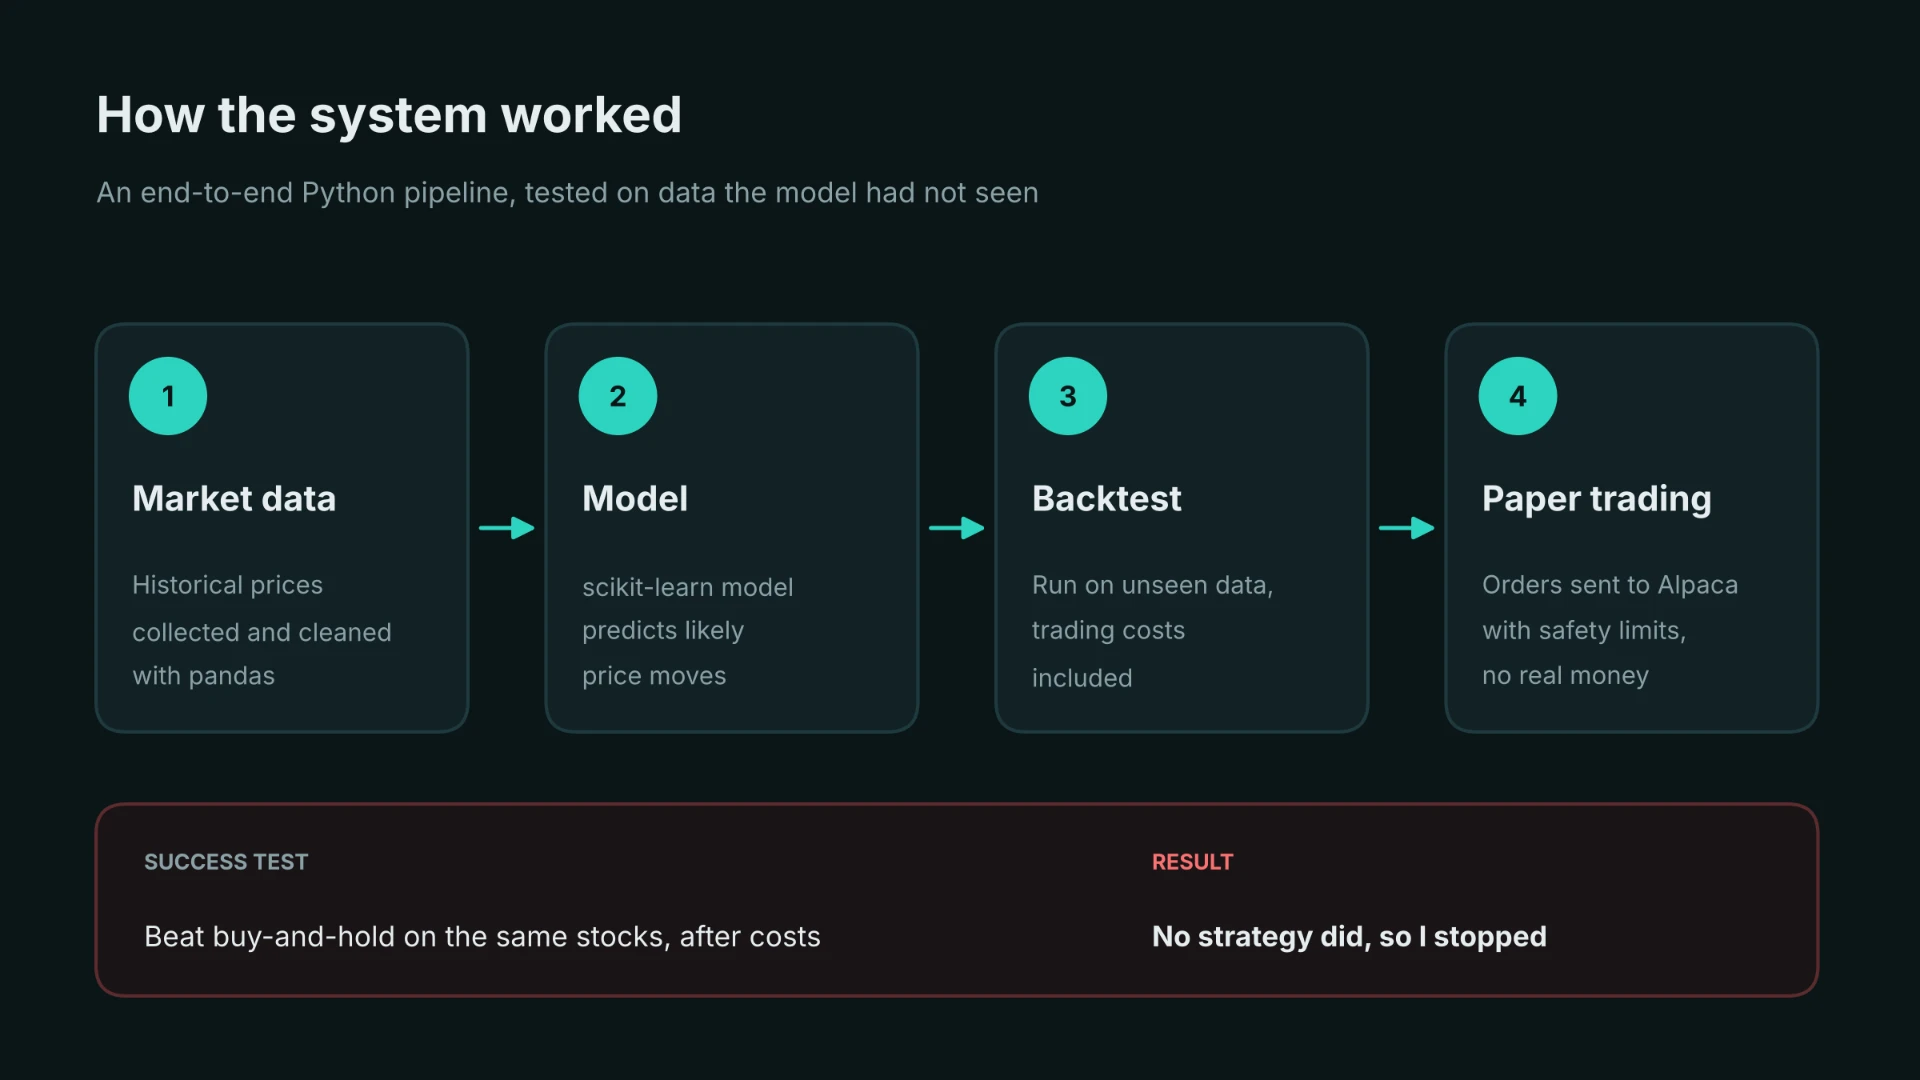
Could an automated system use price data to predict stock movements and earn modest, steady profits? I set a clear success criterion: beat holding the same stocks after trading costs, on data the model had not seen. All orders went to a paper account, with no real money at risk.
What I Built
I built a Python data pipeline, a backtesting framework and a working trading bot connected to Alpaca's paper-trading API. I tested seven families of strategy and risk experiments, plus three intraday strategies, using free Yahoo Finance and Alpaca data. The bot was tested with $100,000 of simulated cash. As the research progressed, the aim shifted from building a profitable bot to honestly finding out whether any approach was profitable.
Key Features
- Time-based train/test splits and yearly walk-forward testing from 2017 to 2026, with next-day execution and gaps where targets overlapped to avoid lookahead
- Trading costs, buy-and-hold benchmarks, stability checks across both halves of the test period and model accuracy compared with the right baseline
- Random Forest direction forecasts, cross-sectional gradient boosting across 30 stocks, volatility forecasts, risk targeting and intraday tests
- Swappable strategy function separated from the order-planning and safety layer; sells planned before buys and every action logged
- Dry run by default, a STOP.txt kill switch, a hard-coded paper account and checks for blocked accounts and closed markets
- Monday-only rebalancing, blocked when the account is down 3% on the day or earlier orders remain pending; exits checked on every run that clears safety checks
- 8% maximum allocation per stock, $5,000 maximum order and no trades below $25
- 15% stop-loss with a 30-day cooldown before rebuying; take-profits disabled after testing showed they reduced returns
- Total exposure of 95% for equal weight, or 25–95% when volatility targeting is enabled
Tech Stack
- Python
- Data pipeline, backtests and trading bot in a Windows virtual environment
- yfinance
- Free daily stock prices and VIX data from Yahoo Finance
- pandas + NumPy
- Data analysis and time-series feature engineering
- scikit-learn
- Random Forest, HistGradientBoosting and Ridge regression
- matplotlib
- Charts and experiment visualisation
- alpaca-py
- Paper-account orders and 5-minute market data from the free IEX feed
- Claude
- Coding and analysis assistance during iterative development
Experiments & Results
- Moving-average crossover
- A 20/50-day crossover on Apple returned 28.0% over five years versus 107.5% for buy-and-hold, across 33 trades.
- Random Forest direction model
- On Apple from November 2023 to November 2026, accuracy was 52.4% versus 53.7% for always guessing up. Return was 43.5% versus 83.4% for buy-and-hold across 85 trades.
- Cross-sectional stock selection
- A top-five weekly portfolio from 30 stocks returned 17.5% a year with a Sharpe ratio of 0.79, versus 19.8% and 1.23 for equal weight. Model AUC was 0.512, close to the 0.50 no-skill baseline.
- Stop-losses and take-profits
- Across 20 combinations, take-profits reduced returns in every setting. A 15% stop alone returned 17.9% a year versus 18.6% without exits, while reducing the worst drop from −31.7% to −26.5%. I retained only the wide stop as a safety net.
- Stock-level volatility forecasting
- The ML forecast's rank correlation was 0.663, no better than 0.665 for trailing 60-day volatility. Inverse-volatility weighting returned 16.8% a year versus 19.5% for equal weight, with Sharpe ratios of 1.20 and 1.25.
- Portfolio volatility targeting
- A 12% target using trailing 20-day volatility returned 14.2% a year versus 18.0% fully invested. The worst drop improved from −31.6% to −17.1%, and Sharpe rose from 1.04 to 1.19: lower risk, not higher returns.
- Matched-risk comparison
- With cash earning an assumed 2%, volatility targeting returned 14.8% a year versus 13.1% for a constant-exposure twin of the same volatility. A block bootstrap estimated a +1.5 percentage-point annual gap, with a 90% range of −0.78 to +3.70 points and an advantage in 87% of resamples. The timing benefit was modest and not conclusive.
- Intraday strategies
- Across 10 stocks and 493 trading days on 5-minute bars, opening-range breakout, VWAP mean reversion and late-day momentum averaged −5.3, −5.1 and −6.9 basis points per trade after a 0.06% round-trip cost. All lacked an edge. Buying at the open and selling at the close also lost after costs; before costs it returned 5.5% a year versus 24.3% for holding the same stocks.
- Paper-account execution
- The first run placed 30 buy orders of $3,166.67 each; a repeat dry run planned no trades. With basket volatility at 16.2% against a 12% target, the bot reduced exposure to 74% and sold about $21,000 across 30 positions. A follow-up dry run again planned no trades.
Challenges & What I Learned
The main lesson was how to test a trading idea honestly. A 52.4% direction accuracy sounds useful until compared with 53.7% from always guessing up. Intraday edges below one basis point disappeared after costs, and predictable volatility did not translate into better returns. Comparing risk targeting with a constant-exposure portfolio of the same volatility helped separate timing benefits from simply holding less stock. Dry runs, hard limits and a kill switch proved more important than the strategy when software controlled an account.
Limitations & Caveats
- The basket used today's large, successful companies, creating survivorship bias that inflates both strategy and benchmark returns.
- Free daily data and Alpaca's partial-volume IEX feed limit price quality, VWAP accuracy and fill estimates.
- Costs were flat estimates, shorting was treated as free and cash earned 0% in most tests; 2% was a rough assumption only in the matched-risk comparison.
- Ten years of daily data and two years of intraday data cover a limited set of market events. Trying multiple variants on the same data introduces selection bias.
- Weekly portfolio drawdowns understate falls within a week, and simulated fills are cleaner than real execution.
- This is an engineering and learning project, not investment advice.
Project Outcome
Completed and stopped after no approach beat buying and holding on return. I closed all paper positions, left the kill switch in place and did not deploy the cloud server. Windows Task Scheduler and a small cloud server were designed but never deployed. The code, data pipeline and backtests remain as a reference; the useful result was that rigorous testing caught plausible strategies that did not hold up, without risking real money.